A process improvement assessment (PIA) is a standard, systematic approach used to identify pain points and sources of error, waste, or inefficiency in a process. Many methodologies derived from manufacturing-based industry exist to guide process improvement assessment and planning. Inasmuch as laboratory processes are similarly attempting to generate a product with minimal error and waste, these methodologies can be directly applied to IHC laboratory processes or applied with minor modifications. An intuitive process improvement method developed by Ford Motor Company in the 1980s is the Eight Disciplines Problem Solving Method (8D).1 This process includes principles found in other methodologies, most notably Lean/Six Sigma.2-7
The 8D method uses the following steps:
- D0: Prepare and plan for the 8D process
- D1: Form a team
- D2: Describe the problem
- D3: Interim containment action (immediate steps to protect patients, if necessary)
- D4: Root cause analysis
- D5: Permanent corrective action (long-term plan, corrective and preventive action plan [CAPA])
- D6: Implement and validate the permanent corrective action
- D7: Prevent recurrence
- D8: Closure and team celebration
Process improvement and planning tools exist to help complete steps of the 8D method:
D0: Prepare and plan for the 8D process
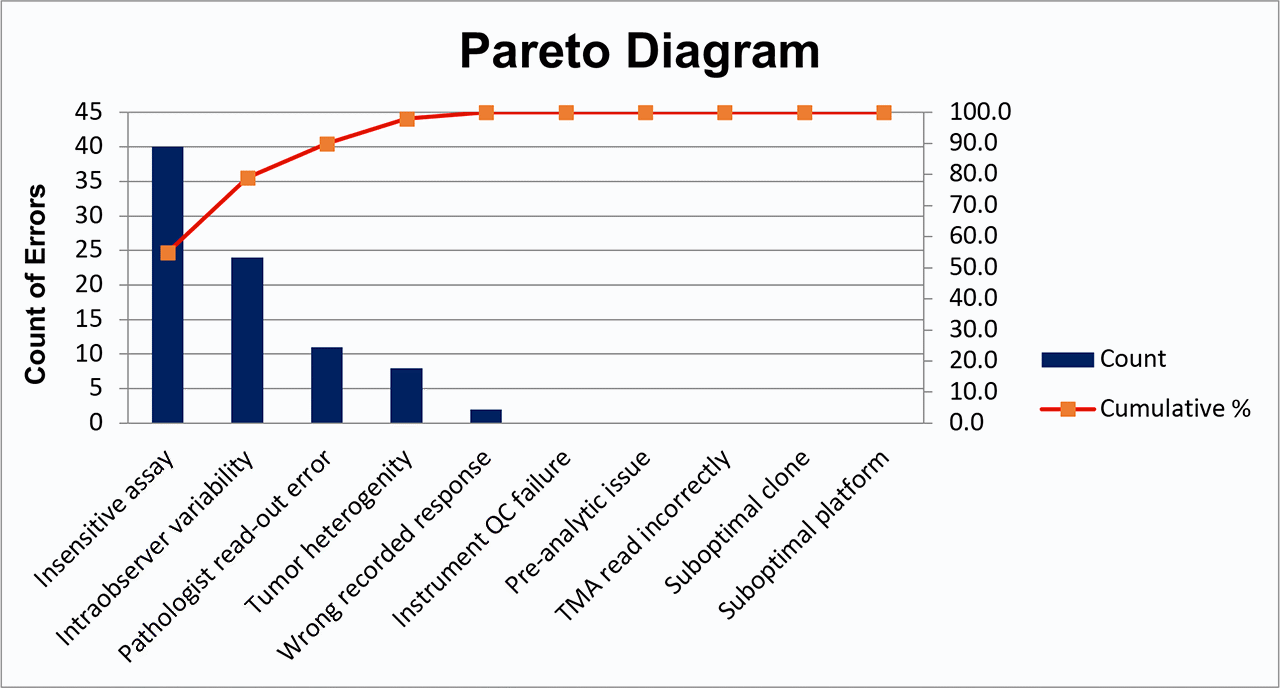
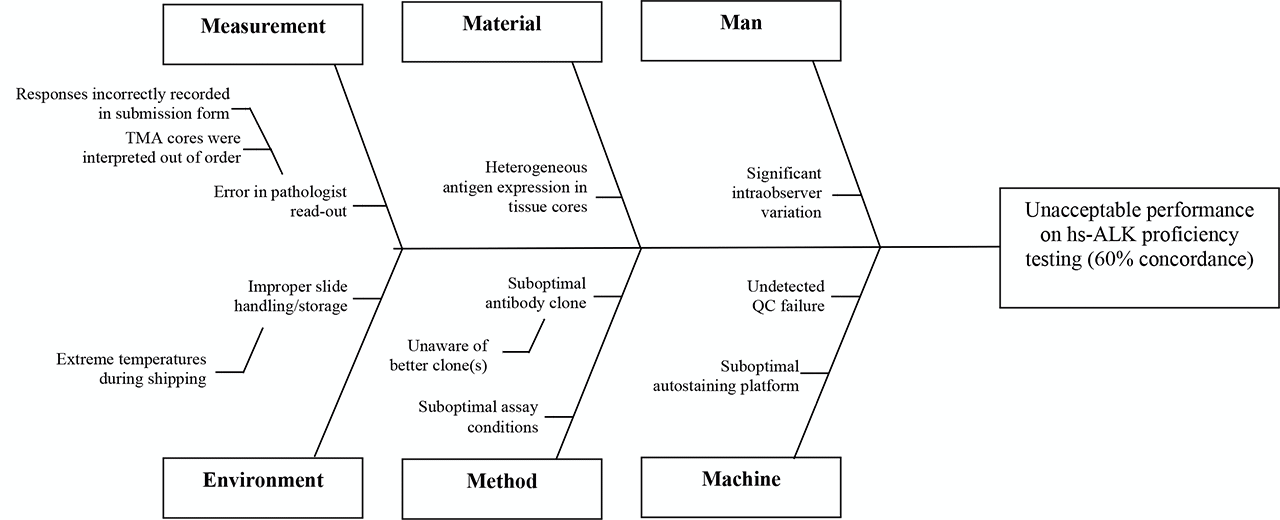
At the beginning of the process improvement assessment, information is collected to estimate the required personnel and time for the project. It may be helpful to use problem assessment templates such as Fishbone or Pareto Diagrams to map the issues and questions to consider for problems identified by PT results or control failures.
At this step, as in step D3, careful consideration must be given to minimizing any effect on patients due to the possible source(s) of error. If it initially appears that the problematic output from the laboratory could have significant negative effect on patients, then a decision about an interim containment plan (step D3) must be made in a timely manner, and the project timeline must reflect this urgency.
In some laboratories, the need for an interim containment plan and timeline for implementation of corrective action may be guided by risk ranking and risk prioritization plans that use established patient safety harm categories and safety assessment code matrices.
Various project management tools can be used to organize and visually represent phases of the project. A Gantt chart (www.gantt.com) is essentially a horizontal bar chart that can be used to visually represent phases of a project and tasks scheduled over time. Gantt charts can be created using a template within Microsoft Excel.
D1: Form a team
In this step, a multidisciplinary team representing relevant stakeholders is assembled. Responsibilities need to be clearly assigned: A team leader—and, for major process improvements, a senior “champion”—should be identified. The latter is someone with sufficient organizational clout to minimize obstacles that may come up during the process. For example, in the case of a faulty breast predictive marker, the team could include breast pathologists or the pathology chief, the IHC medical director, breast surgeons and/or oncologists, and laboratory staff.
Tools are available to help identify process parts and stakeholders, and to assign responsibilities such as a SIPOC diagram or responsibility assignment matrix.
D2: Describe the problem
The problem definition may appear straightforward; however, it’s always best to approach problem definition in an open-minded manner driven by genuine curiosity. A common tool used for problem definition is called “Five Whys,” where one repeatedly self-questions explanations.
Here’s an example: The issue at hand is that the laboratory did not achieve acceptable concordance with the intended responses for a proficiency test:
Ask why #1:
Because, compared to the intended responses, we resulted in 3 of 10 cores on the TMA getting a negative response when the intended response was positive.
Ask why #2:
Because we didn’t see staining in these cores.
Ask why #3:
Because it’s possible our assay is insufficiently sensitive to detect the protein of interest in these three cores.
Ask why #4:
Because our assay parameters don’t align with those reported by the majority of participating laboratories using similar platforms.
Ask why #5:
No reason; we didn’t realize that our assay parameters were different than those used in other laboratories using similar platforms, so we failed to consider the most commonly used parameters when we performed the initial validation.
So, in this example, a problem definition may be: Our IHC assay appears insufficiently sensitive to detect low positive results, potentially due to suboptimal assay parameters.
Other tools used in this step may include simple flowcharts, Fishbone diagrams, Is/Is not comparison, or affinity diagrams.
D3: Describe the problem
Based on the problem definition, an interim containment action should be verified and implemented if necessary. An interim containment plan is intended to be a preliminary stopgap and is often replaced by the permanent corrective action (step D5). In immunohistochemistry, the easiest interim containment plan is to stop performing the assay in-house and send-out material to a reference laboratory.
D4: Root cause analysis (RCA)
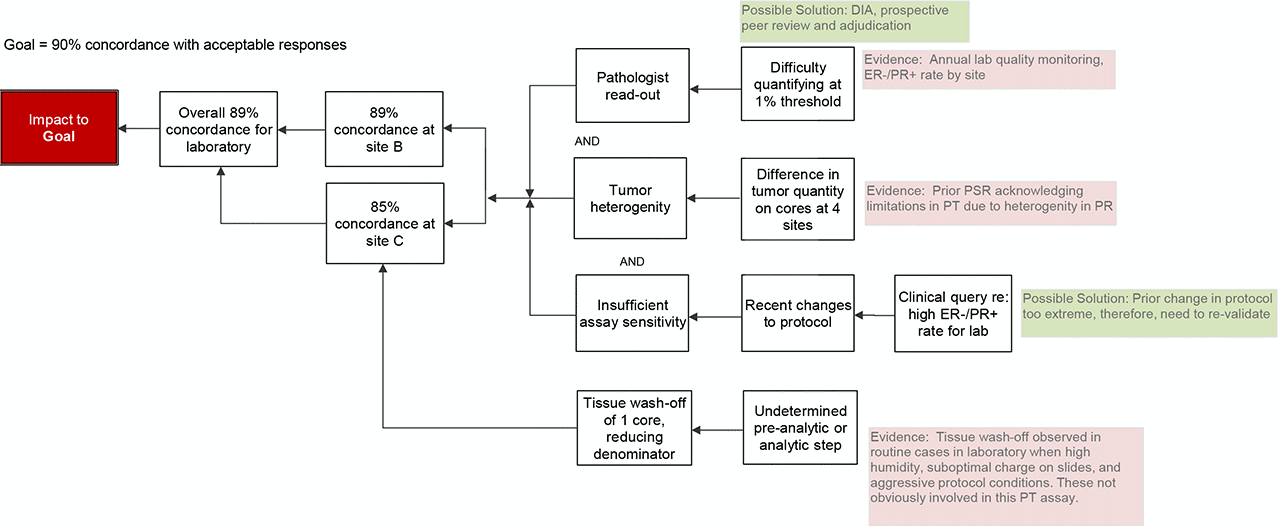
The root cause analysis (RCA) will take different forms with different tools applied, depending on the problem definition. The goal of a RCA is to determine the primary source of the error and the escape point, or the first point at which the error might have been detected but was not.
Tools such as failure mode and effect analysis (FMEA), fault tree analysis, or possibly a value stream map can be applied. Some tools from step D2 are also helpful in a RCA (Five Whys, Fishbone diagram). In the process of performing an RCA, more potential sources of error may be identified—using our previous example, while looking at all testing phases, the lab may also discover that the particular TMA slide wasn’t handled in the recommended manner prior to testing (possible global decrement in antigenicity), that the pathologist readout was near a subjective, difficult to reproduce threshold, or that there was a simple clerical error and that the readout pathologist selected the wrong bubble responses (negative, <1% when intended to select positive 1–10%). If other sources are identified, the problem definition and possible solutions can be further expanded.
It remains advisable to approach the RCA with an open-minded, genuine curiosity. While pursuing the root cause and escape point, it’s imperative that team members and team leaders cultivate a non-pejorative, transparent team culture.
D5: Permanent corrective action (PCA)
The permanent corrective action is directed against the root cause and removes or alters the conditions that were responsible for the problem. Prior to selecting the permanent corrective action (PCA), acceptable performance criteria must be established, including any mandatory performance criteria, and the effectiveness of the PCA must be demonstrated.
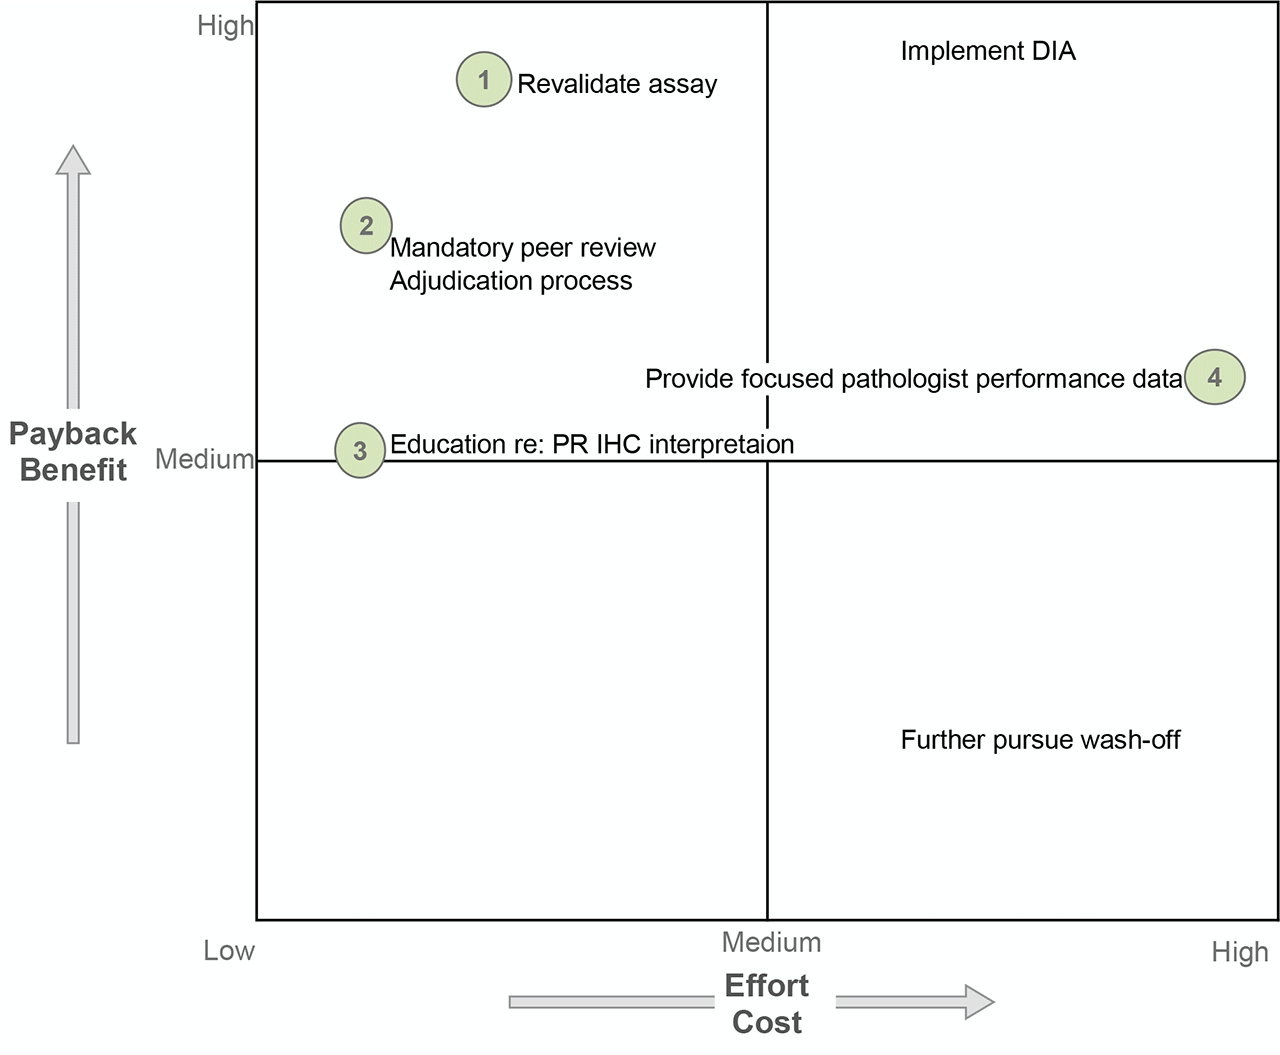
When there’s a choice of PCA, the team leader must work to make a balanced choice and to consider favoring choices that attend to the escape point as well, so that if error reoccurs, it will be captured at the escape point and any effect on patients may be minimized. (The escape point for predictive markers is likely to be correlation with morphology [such as in breast], results of peer review or adjudication procedures, or quarterly quality monitoring reports.) Tools exist to assess choices (FMEA), but often the team’s professional judgment or asking questions of a colleague with more experience at another institution are sufficient to make a choice.
D6: Implement and validate the permanent corrective action
After a PCA has been chosen, the performance of the PCA—using performance criteria specified in step D5—must be validated. Continuing with the example of insufficient assay sensitivity, a laboratory may choose to revalidate the assay using increased incubation time for the primary antibody. Depending on the application of the marker in question, achieving acceptable concordance with a pre-determined gold standard in the required number of cases for assay validation will constitute demonstration of effectiveness of the PCA.
After validation of the PCA, the team must develop a plan for implementation and clearly communicate this plan with all stakeholders. If the problematic assay was still being performed in-house while the process assessment was being performed, it may be necessary to consider or offer repeat testing on those patient samples with the implemented PCA.
D7: Prevent recurrence
To prevent recurrence of the problem, it’s necessary to perform regular, systematic monitoring after implementation to continually confirm effectiveness of the PCA. It may be that more frequent monitoring is done in the short-term, then after a period of acceptable performance, the laboratory may be reassured that the effectiveness is durable and shift to less frequent monitoring. However, if at any point monitoring indicates that the assay is not performing acceptably, a process improvement assessment may be re-initiated.
Additional changes in the laboratory at this stage include standardizing workflows, updating relevant policies, and sharing the process improvement assessment experience with others in the organization.
D8: Closure and team celebration
The last steps in the 8Ds framework include closure and celebration. This step includes a team debrief and the archiving of the process improvement assessment documents. It is recommended that document templates be used when possible to guide the assessments. A team debrief is important to discuss the process and to identify assessment elements that may be improved next time. Lastly, it’s crucial for team leaders to recognize the contributions of team members and celebrate their success.
Resources
References
- Eight Disciplines of Problem Solving (8D). Quality one. 2021. Retrieved on February 16, 2021 from: https://quality-one.com/8d/#what
- VHA National Center for Patient Safety. 2021. Retrieved on February 16, 2021 from: https://www.patientsafety.va.gov/professionals/index.asp
- National Coordinating Council for Medication Error Reporting and Prevention. 2021. Retrieved on February 16, 2021 from: https://www.nccmerp.org/types-medication-errors
- Heher YK. A brief guide to root cause analysis. Cancer Cytopathol. 2017 Feb;125(2):79-82.
- Heher YK, Chen Y, VanderLaan PA. Pre-analytic error: A significant patient safety risk. Cancer Cytopathol. 2018 Aug;126 Suppl 8:738-744.
- Simon K. The Cause and Effect (A.K.A. Fishbone) Diagram. isixsigma.com. Retrieved on February 16, 2021 from: https://www.isixsigma.com/tools-templates/cause-effect/cause-and-effect-aka-fishbone-diagram/
- Cause Mapping ® Method Investigation File. Downloaded from www.thinkreliability.com. Template version 2020-v1.
Last updated: November 4, 2025